Logs Page
This document provides basic information on logs page and how to filter logs based on flow names, logs levels and time interval.
Logs Page vs. Executions Page
To avoid confusion by tons of different logs in your Executions, we have decided to keep only the most important logs on the Executions Page. You will still be able to access the list of all the available logs on the dedicated Logs Page.
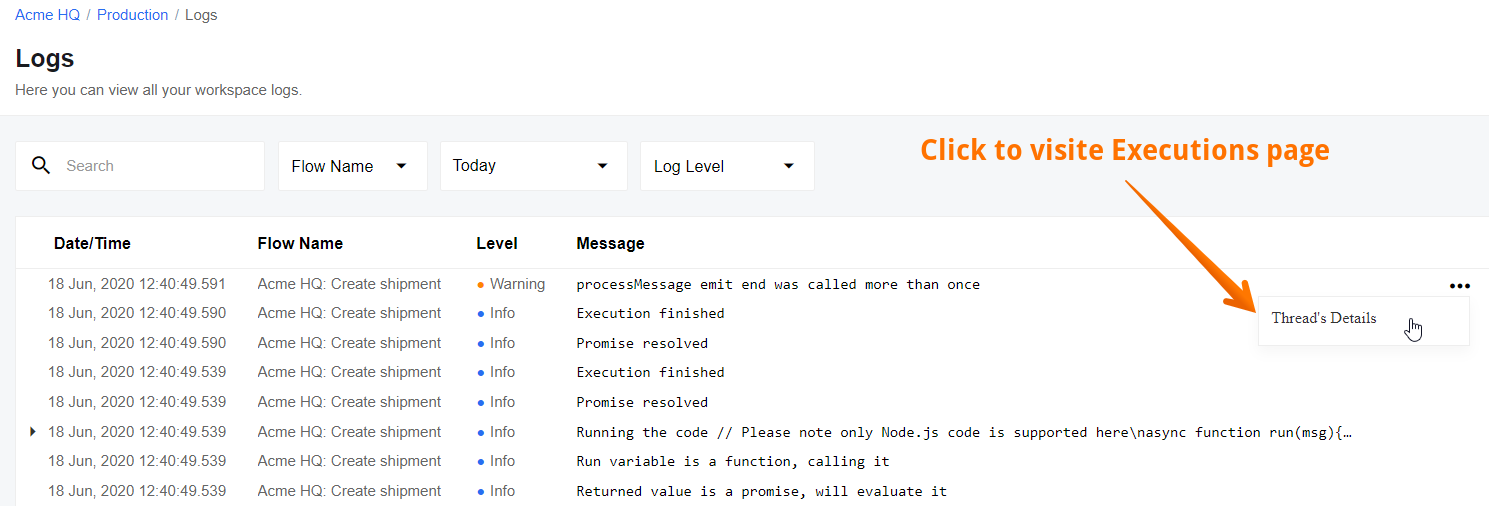
The new page lists all the logs for all the Flows in the given workspace. You can use search to find specific logs:

Additionally, the list can be filtered by a flow name, time interval and the log level.
You can also go to the Executions page simply by clicking on the “Thread’s details”:
Please note that in case you are interested in all logs of a particular workspace, you can use the corresponding API Call for that.
Filter by Flow Name
This filter allows you to concentrate on logs of one or more Flows by selecting the check-boxes in front of their names in the drop-down menu.
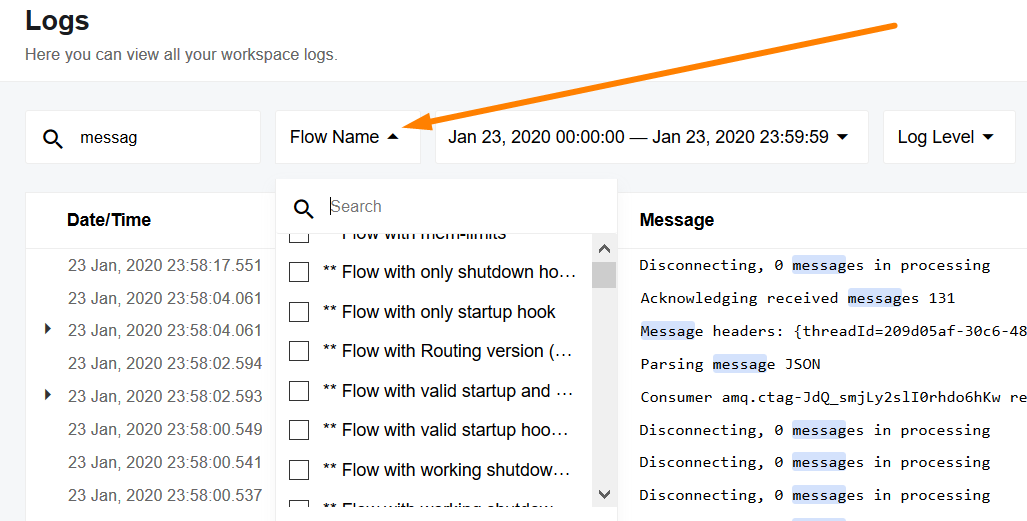
You can select more than one flow if you need to debug related flows. Here you can search for the flow names to find the relevant flows faster.
Note, by deselecting all (or pressing Clear) you will return to the default view of all executions from all the active flows.
Filter by Time Interval
This filter allows you to list logs based on their time. A drop-down menu offers a calendar view where you can customize and concentrate on the required time interval.
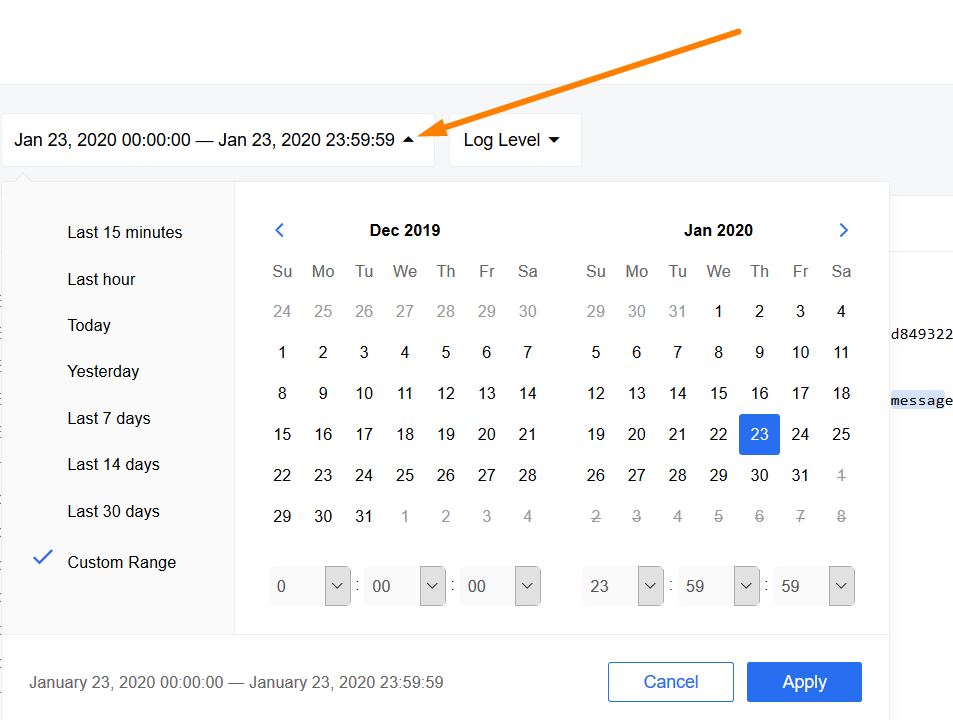
Picture above shows the default view of the time interval with today’s logs.
You can select any of the predefined options like last 15 minutes, last hour,
today, etc. Or you can customize it further using the calendar view by selecting
the starting date and end date. You can also select the starting and ending hour
of the interval:
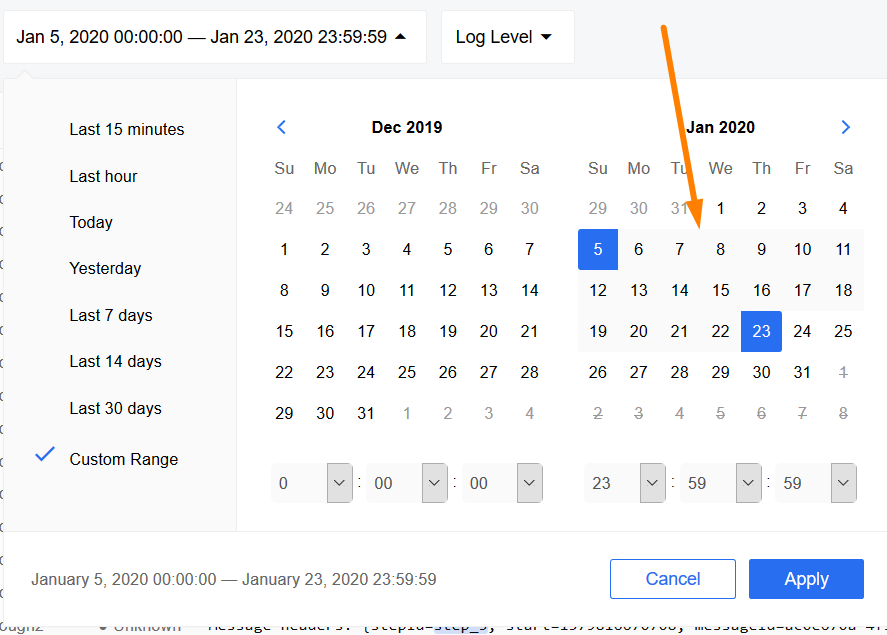
Note - you must press Apply for it to take effect. You will know it worked when the check-mark shows the Custom Range and the name interval menu shows the selected interval instead of Today.
Filter by Log Level
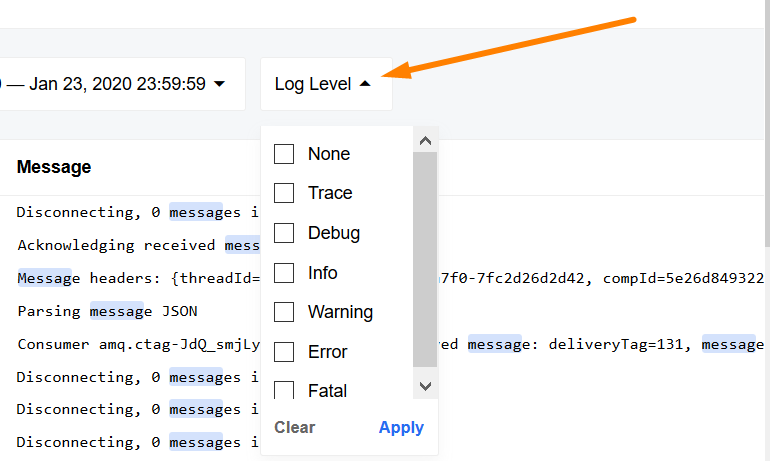
This filter allows you to list logs of the same type (level), like Error, Debug, Info, etc.:
